

.png)
.png)
.png)
A Conference Room Full of Dashboards. And Zero Answers.
Let me set the scene. A professional services firm. Dozens of Power BI reports. A finance team that should have every number at their fingertips.
And yet, when the VP of Finance wanted to know billable utilization for a specific consultant, the process looked like this: open Power BI, drag the right measure onto the canvas, apply three filters, scroll through a list of 200+ names, squint at a bar chart, and hope you picked the right fiscal period. That's not analytics. That's archaeology.
For people who didn't know DAX or understand the report structure? They simply couldn't participate. The data existed. The answers existed. But there was a wall between the people who needed decisions and the systems that held the truth.
This is the villain I kept encountering in the field: not bad data, not missing tools, but friction. The kind of friction that turns a 10-second question into a 3-day ticket to the analytics team.
What I Actually Walked Into
When the client asked us to implement their Power BI measures in Databricks Genie, I expected the hard part to be the technology. I was wrong.
The hard part was the knowledge gap.
The client couldn't fully explain their own KPIs. Measures had been built over years by different analysts: layered, patched, undocumented. The DAX logic was tribal knowledge. Metadata descriptions were either missing or misleading.
This is a pattern I've seen across engagements, and the Genie Playbook names it clearly. Before you can deploy Genie, you need governed data in Unity Catalog and well-documented tables and metadata. Without that foundation, any AI layer, no matter how capable, is building on sand.
So I rolled up our sleeves. I reverse-engineered the DAX. I mapped the joins. I wrote rich descriptions for every table and column in Unity Catalog. Turned implicit business logic into explicit, governed metadata.
It wasn't glamorous. But it was the work that made everything after it possible.
Following the Playbook, With Field-Tested Adjustments
The Genie Playbook lays out a three-phase approach: LOB Alignment -> LOB Discovery & Workshop -> Deployment. Here's how each phase played out, and what I'd recommend for anyone taking Genie to a Finance LOB.
Phase 1: LOB Alignment. Finding the Right Pain.
The playbook says to prioritize LOBs by Technical Readiness + LOB Relationships + Value at Stake. For this client, Finance was the clear target. The KPIs (Revenue, Billable Utilization, EBITDA Margin, Write-Offs) directly impact the firm's bottom line. A 20% write-down can wipe out 50% of net profit. That's not a reporting problem. That's a P&L emergency.
I identified the Tech Champion: a VP of Finance exhausted by the reporting backlog and hungry for a better way.
Phase 2: LOB Discovery. Speaking Their Language.
I didn't walk in talking about SQL or data models. Following the playbook's Discovery Guide, I asked questions that mattered to them:
- "What are the top departments with the highest opex variance to budget this quarter?"
- "How much did write-offs and write-downs eat into your net revenue last quarter?"
- "Which consultants have the lowest billable utilization in the Chicago office, and what's the revenue impact?"
The playbook calls this "confirming value": mapping questions to real decision points. When the VP of Finance heard these questions spoken back to her, she leaned in. These weren't hypothetical. These were the questions keeping her up at night.
Phase 3: Deployment. The Moment It Clicked.
I curated a Genie Space with the client's actual metrics: revenue by office, billable utilization by consultant, write-off rates by practice area, budget variance by cost center. Every measure mapped to governed data in Unity Catalog. Then we ran the demo.
The Moment the Room Changed
I typed the first question into Genie:
"Tell me the total revenue generated from the Chicago office."
Four seconds. A clean, accurate answer. The room went quiet. The good kind of quiet.
Then it got personal.
Someone asked: "What's Daryl's billable utilization?"
Genie answered instantly. Then: "Can you compare his utilization with Steve's?"
Done. Side by side. No filters. No DAX. No waiting.
Within minutes, the entire room was playing with Genie, asking about colleagues, offices, practice areas, quarters. People who had never opened Power BI were suddenly interrogating their own data in plain English. Laughter and surprise replaced the usual glazed-over dashboard fatigue.
That was the "Aha!" moment the playbook describes. But it wasn't about the technology. It was about inclusion. Stakeholders who had been locked out of their own data for years were suddenly first-class participants in the analytical conversation.
What Actually Changed for the Customer
Before Genie:
A finance leader wants to check utilization for a specific team. They open Power BI, select the right report (hoping it's the current one), drag the utilization measure, apply practice area and date filters, scroll through a long employee list, and manually compare values. If they want to compare two people, they repeat the process. If they don't know Power BI, they email the data team and wait two to three days.
After Genie:
They type: "Compare Daryl's and Steve's billable utilization for Q3." Answer in seconds. No training required. No intermediary needed.
This isn't an incremental improvement. It's a category shift in how the organization relates to its data. The playbook's measures of success all materialized:
- LOB Commitment: The VP of Finance became Genie's internal champion, pitching it to the CFO without us asking.
- Net New Users: Non-technical stakeholders (practice leaders, regional managers, HR) started using Genie daily. People who had never logged into an analytics tool before.
- ROI Unlocked: The team shifted from 'waiting for reports' to 'acting on answers.' Decisions that took days started happening in meetings, in real time.
A Field Tip: Lead with the Revenue Leak
If I could give one piece of advice to anyone bringing Genie to a Finance LOB, it's this:
Don't start with a generic demo. Start with the question they can't currently answer fast enough.
Walk into the room and ask the CFO: "How much did write-offs and write-downs eat into your net revenue last quarter, broken down by practice area?"
When they pause (because the answer requires pulling three reports and a spreadsheet), that's your opening. Show them Genie answering it in seconds.
Finance leaders obsess over these leaks. A 20% write-down is a 50% hit to net profit. When you position Genie as their "Revenue Leak Detector", something that spots margin erosion by client, by practice, by quarter in real time, you aren't selling a tool. You're handing them a weapon. And they'll pitch it to their boss themselves.
How We Win with Genie: A Repeatable Go-to-Market Play
This engagement wasn't a one-off. It revealed a repeatable pattern for how we should take Genie to market across every Finance LOB and beyond. Here's the play:
Step 1: Lead with a Provocation, Not a Product
Don't open with "let me show you Databricks Genie." Open with a question the LOB leader can't answer today: "What's your margin leakage by practice area this quarter?" or "Which cost centers are trending 15% over budget right now?"
The playbook's Discovery Guide provides the framework. But the real move is making the leader feel the gap between their question and their current time-to-answer. That gap is where Genie lives.
Step 2: Identify the 5 Questions That Run the Business
Every LOB has 5 to 10 questions that drive 80% of their decisions. For Finance, I found them in the playbook's domain map:
- Revenue and margin by office, practice, and client
- Billable utilization by consultant and team
- Write-off and write-down rates by practice area
- Budget variance by cost center and department
- Opex run rate vs. forecast for quarter-end projection
These become your Genie Space's foundation. Don't try to boil the ocean. Five killer questions beat fifty mediocre ones.
Step 3: Do the Metadata Work Before the Demo
This is where most implementations stumble, and where I've seen the biggest differentiation happen. Before any demo, invest in:
- Rich column and table descriptions in Unity Catalog
- Clear business definitions for every KPI (what counts as 'revenue'? Gross or net? Billed or recognized?)
- Sample questions and instructions baked into the Genie Space
- Verified SQL that matches the client's existing Power BI or Excel calculations exactly
When the numbers match what the business already trusts, credibility is instant. When they don't, you've lost the room.
Step 4: Make the Demo Personal
The breakthrough in our engagement wasn't "show me total revenue." It was "show me Daryl's utilization." The moment people see their names, their teams, their numbers, they stop evaluating a tool and start imagining a future. Use real data. Use real names. Make it personal.
Step 5: Let the LOB Leader Sell It Internally
The best outcome isn't closing a deal. It's when the VP of Finance walks into their CFO's office and says, "You have to see this." That happened in our engagement. Unprompted. The playbook calls this LOB Commitment, but it's really about creating an internal champion who does your selling for you. Position Genie as their win, not yours.
Beyond Finance: The Pattern Repeats Everywhere
This play isn't limited to Finance. It maps identical patterns across every major LOB:
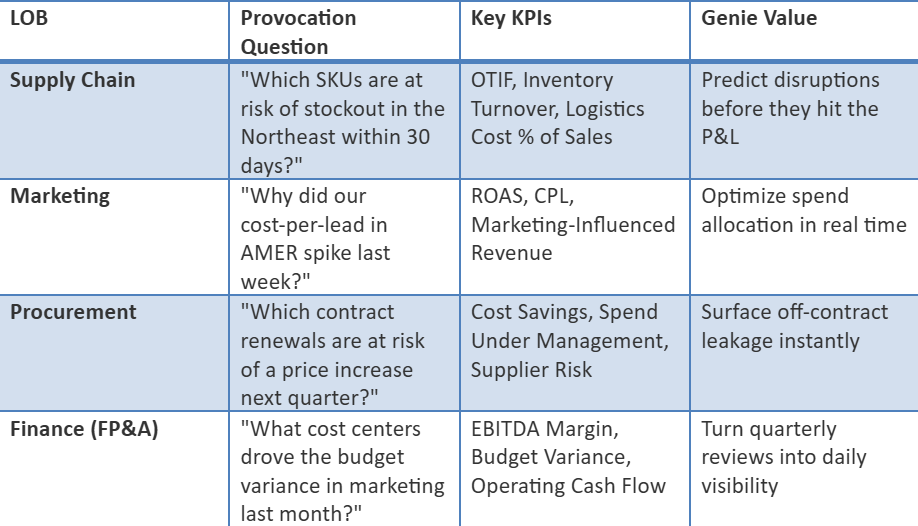
We're Not Implementers. We're Translators.
The hardest part of this engagement wasn't configuring Genie or writing SQL. It was the translation work: taking undocumented business logic trapped in someone's head, encoding it into governed metadata, and giving it back to the organization in a form that anyone could use.
That's the real value we deliver. Not dashboards. Not reports. Decisions.
When a practice leader can ask, "What's my team's revenue at risk from write-downs this quarter?" and get an answer before their coffee gets cold, that's not a feature demo. That's organizational transformation.
Databricks Genie doesn't just answer questions. It eliminates the distance between curiosity and action. And when we, as field practitioners, learn to lead with the right provocation, anchor on governed data, and make the demo personal, we don't just deploy a product. We change how organizations think.
.png)

.png)