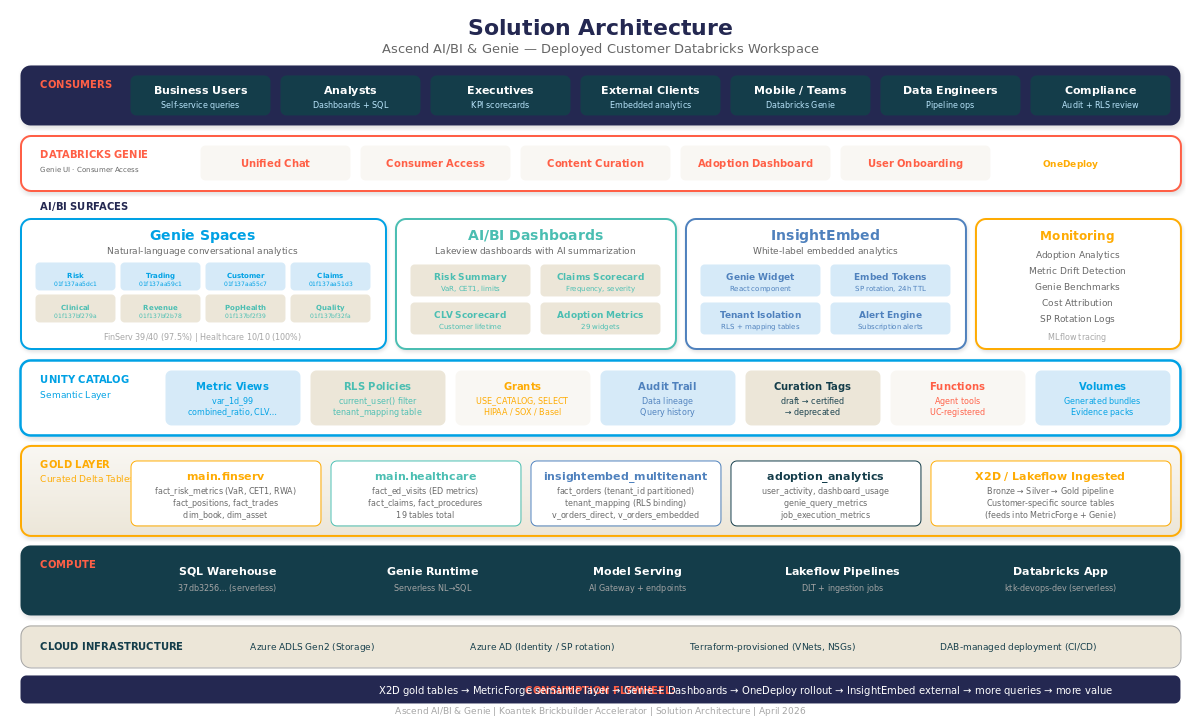
Across several enterprise Databricks Genie engagements (in semiconductor, professional services, life sciences, and manufacturing), the same operational pattern keeps showing up. The architecture is right. The hard parts are the same hard parts every time.
Four gaps tend to show up before a deployment reaches 100 active users. Somewhere in the second month, an analytics lead usually asks a pointed question: "Is this thing getting better or worse?" The architecture has to give a measurable answer.
Ascend AI/BI is the program we built so that answer is measurable and visible. Pre-curated domain blueprints. Benchmark automation with CI/CD accuracy gates. A managed semantic layer on Unity Catalog Metric Views. Parallel-run validation tooling for migrations. A weekly feedback-to-refinement loop with human approval on every change. The work that used to live across our delivery team now ships as a productized program on Unity Catalog.
The gap between primitive and program
Genie is one of the best primitives Databricks has shipped: natural-language SQL against Unity Catalog with first-class dashboard integration, governed instructions, and a benchmarking surface, all on the same platform that runs your warehouse. The architecture is right.
The work is in the rollout. Turning Genie into something an enterprise can deploy to 500 business users across 20 domains is a different job from getting the first space working. Four operational gaps show up on most enterprise Genie deployments we've worked on.

- Artisanal authoring at scale. Domains compose 1,000+ character instruction blocks from scratch. No reuse. Quality varies by engineer. Each space takes 10–15 days of hand-tuning before it's ready for non-technical users.
- Metadata bottleneck. Less than 20% of client UC schemas arrive with adequate column comments, value dictionaries, or join documentation. Genie accuracy degrades sharply without them, and it's rare to find an engineer with three days to spare for writing column comments and value dictionaries by hand.
- No production-readiness signal. Spaces go live without baseline accuracy measurement. Regressions after instruction edits stay invisible until a customer escalates. There's no gate to prevent a bad update from reaching prod.
- Feedback that goes unread. Users thumbs-down questions. The data sits in `system.access.audit`. It rarely gets reviewed. Space quality degrades silently for months.
If you've shipped a Genie space to real users, you'll know which of those four mattered most for you. Ascend AI/BI is what addressing all four at once looks like once you've productized it.
The Five Modules
Five horizontal modules and four industry accelerators, all on Unity Catalog:
- Genie Space Factory: productized Genie space delivery
- MetricForge: Unity Catalog Metric Views as a managed semantic layer
- ConvertBI: Power BI / Tableau migration with companion Genie spaces
- InsightEmbed: embedded analytics for SaaS and external users
- OneDeploy: enterprise rollout for the AI/BI consumer experience (formerly Databricks One; Genie UI with Consumer Access)

Each module produces deliverable artifacts at predictable cost and predictable quality. The shift from services to products is what made that possible. The three modules below are the ones with the most production miles, so I'll walk through those. InsightEmbed and OneDeploy are covered in the landing-page brief.
1. Genie Space Factory: blueprint, benchmark, deploy, refine

The pipeline has five components.
- Space Blueprint Library. Six pre-curated domain blueprints (Sales, Marketing, Finance, Supply Chain, HR, Customer Support). Each one has 500+ words of instructions, ≥5 annotated SQL examples, ≥3 trusted UC tables, and 10–15 benchmark questions. They're parameterized via schema-mapping YAML so a new client engagement starts at ~70% complete.
- Metadata Engineering Toolkit. LLM-generated column comments, value dictionaries, and join graphs, with a human approval gate. What used to be 3–5 days of hand-written metadata work is now ≤8 hours with ≥90% coverage.
- Benchmark Automation Suite. 10–20 LLM-drafted benchmark questions per space, human-approved, baseline-locked. A `benchmark_run.py` job runs on schedule, results land in `koantek_meta.benchmarks.results`, and an AI/BI dashboard shows accuracy trends with regression alerts when accuracy drops more than 10 percentage points.
- CI/CD scaffolding. Declarative Automation Bundles (DABs) + GitHub Actions workflow with per-environment accuracy gates: dev ≥60%, staging ≥70%, prod ≥80%. Promotion is gated on the benchmark pass. The `databricks bundle deploy` step itself runs in your team's existing CI; the factory provides the scaffolding and the accuracy gates and hands off there. Every promotion logs to `koantek_meta.cicd.deployment_log` with the git SHA, the benchmark accuracy, and a rollback reference.
- Feedback-to-Refinement Loop. Daily ingestion of Genie thumbs from `system.access.audit`, weekly HDBSCAN clustering of failure patterns, LLM-drafted refinement candidates, **human approval on every change**, and closed-loop re-benchmarking. The loop produces a measurable refinement curve week over week.
The number that matters: 10–15 days of artisanal authoring collapses to roughly 3 days per domain, with an ≥80% benchmark baseline at deploy and a measurable refinement curve thereafter.
2. MetricForge: The Semantic Layer is the Lift

Many hard to solve genie and dashboard problems are actually a metric-definition problem.
Most analytics organizations show the same pathology. Finance defines revenue one way, Sales another, Marketing a third. A single executive dashboard shows three conflicting numbers and nobody can tell you which is right. Genie inherits that problem instantly: natural-language questions resolve to ad-hoc SQL against raw fact tables, and Genie's first wrong answer is expensive to recover from.
UC Metric Views fixes the technical layer well: typed measures, time-grain dimensions, native Genie integration. Hand-authoring YAML for 50 metrics, certifying them, tracking ownership, detecting drift, and deprecating stale ones is two weeks of work nobody plans for. So the metric layer often never gets built, and Genie answers go straight to free-form SQL.
MetricForge has three components designed to make that work tractable.
- Metric Drift Detection. Schema drift monitor (daily), ad-hoc/shadow IT bypass detector via embedding similarity against `system.query.history`, and value drift monitor with 30-day baselines.
- Metric View YAML Generator. Auto-generates draft Metric View YAML from existing SQL queries, Power BI DAX, and Excel glossaries, with a human review step before certification. A 50-metric catalog goes from 1–2 weeks of manual authoring to roughly 2 days.
- Metric Governance Framework. UC-tag ownership, batch certification CLI, UC Lineage API extraction, 90/180-day deprecation engine with Slack escalation, and a Metric Registry Dashboard.
The result: every certified metric has an owner, drift is detected within 24 hours of schema or value change, and ad-hoc bypass (analysts re-deriving certified metrics in a notebook because they didn't know the certified one existed) gets flagged before it ships to a dashboard.
3. ConvertBI: The Migration that Pays for Itself

ConvertBI started as a customer ask: We have 400 Tableau dashboards. How do we get off?
The honest answer is that 30–40% of those dashboards haven't been opened in 90 days. Half of the rest can be merged. Of the survivors, maybe 40 are genuinely strategic. The hardest part of the migration is the discovery and the kill list, well before the technology.
ConvertBI's audit tool produces an inventory of every dashboard, scored on complexity (Simple / Medium / Complex / Very Complex) and usage (Active / Stale / Cold / Dormant), in under four hours. The decommission recommendation is part of the deliverable. We've yet to see a customer reject more than 20% of the proposed kill list. Most accept the whole thing because the data is unarguable.
The semantic translation engine handles DAX → Databricks SQL with confidence tiers, and Tableau LOD calc-fields (FIXED / INCLUDE / EXCLUDE) translate to window functions. The 25+ AI/BI dashboard reconstruction templates pair with Databricks Genie Code in a preview-assisted authoring workflow that produces Simple-tier dashboards in minutes. Every migrated dashboard ships with a companion Genie space auto-derived from the translated SQL, so the customer ends the engagement with both dashboards and a conversational layer per dashboard.
Parallel-run validation is the part that gives CFO and CISO sign-off. Side-by-side legacy vs. migrated query results, YAML-configured tolerance per metric (EXACT / APPROXIMATE / DIRECTIONAL), shape and numeric parity scoring, and a markdown discrepancy report signed by the customer's BI lead before cutover.
The compound effect: a target of 200 dashboards migrated in 4–8 weeks (typical baseline: 4 months), 30% of legacy assets retired in the same engagement, and companion Genie spaces answering NL questions on day one.
What we Learned Shipping this to Real Customers
Three lessons that surprised me. They might surprise you.
1. The benchmark is the contract
What customers ask for, in nearly every conversation about Genie quality, is observability: show me the line chart, show me the regression, let me see the gate fire.
The single most important artifact we deliver is the benchmark dashboard: the line chart of "how accurate is this Genie space, over time, against questions we've all agreed are the right test." Customers want to see the numbers move. They push back when the numbers aren't visible.
The benchmark gate in CI/CD is the second most valuable artifact. I tried to push an instruction change and CI said the benchmark dropped from 88% to 72%, what happened? is the right kind of conversation to have. Without the gate, that conversation only happens after a user complains.
2. The Semantic Layer is the Accuracy Lift
The fastest accuracy lift we've measured on a customer Genie space came from rebuilding the trusted-tables layer on top of certified Metric Views.
When Genie resolves "what was last quarter's revenue" against a typed Metric View with a defined time-grain dimension, it gets the answer right every time. Against three fact tables with three plausible `revenue` columns, it does not.
The lesson: a right semantic layer makes Genie smart for free. Most of the work people put into instruction-block tuning would be better spent making sure the underlying Metric Views are correct, certified, and the trusted-tables layer points at them.
3. Adoption is Program Work
The Genie UI with Consumer Access experience (formerly Databricks One;) is genuinely good. Getting 300 business users to live in it is six different jobs: groups, permissions, content curation, training, adoption tracking, and reversible onboarding. Every one of those six jobs is program work. The platform doesn't do them for you.
OneDeploy exists because customers were reinventing the rollout from scratch: clicking around the SCIM API, writing one-off Slack onboarding scripts, hoping the CISO would sign off on the audit posture, watching 100-user cohorts stall at 30 active users with no early warning. Productizing the rollout (declarative group config, batch CLI onboarding with rollback, UC-tag-based content certification, daily adoption metrics with thumbs-down clustering) tends to turn a 6-month rollout drag into a 6–12 week engagement that finishes.
If your AI/BI consumer rollout has stalled past 50 active users, the cause is usually one of those six jobs.
Where we go from here
Ascend AI/BI ships today. We've put it in production across semiconductor, professional services, life sciences, and manufacturing.
> Customer benchmark (under NDA): On a recent engagement with a top-5 carbon black manufacturer, our benchmark suite measured Genie accuracy of >99% against legacy Power BI on the customer-approved question set, across 17 plants. Question count, sampling method, and full benchmark methodology are available under NDA.
The piece I'm most excited about for the next two quarters is the vertical accelerator catalog. Enterprise buyers buy industry outcomes: Healthcare analytics, FinServ analytics, Retail analytics. Genie is the runtime; the industry pack is the deliverable. Translating horizontal capabilities into industry-specific data models, regulatory framing, and pre-validated benchmark questions is where the next compound is.

Today, Healthcare and FinServ have shipped to customer environments and run our four-quadrant benchmark suite; the wider Genie Factory hardening for those verticals is in QA-ready state. Manufacturing is local-ready with industry yield, OEE, and MTBF metric definitions. Retail/CPG is pattern-proven on a 16-metric catalog. The 10-axis hardening roadmap upgrading the latter two from "pattern proven" to "enterprise-grade reference implementation" is what most of my team is working on this quarter.
If you're operating a Databricks Lakehouse and trying to figure out how to get from 5 Genie pilots to 50 governed Genie spaces, we'd love to compare notes. We've shipped this pipeline; the playbook is documented and the benchmark gates are reproducible.
About the Author:
Eddie Edgeworth leads Ascend AI/BI at Koantek, a Databricks Brickbuilder Partner. He's built data platforms across pharma, financial services, and industrial manufacturing for the past decade. Find him at Koantek.com or write at edward.edgeworth@koantek.com.

.png)


.png)
.png)
.png)
.png)